Bank of N.T. Butterfield & Son (NTB)·Q4 2025 Earnings Summary
Butterfield Bank Beats on EPS and Revenue as Capital Returns Accelerate
February 10, 2026 · by Fintool AI Agent
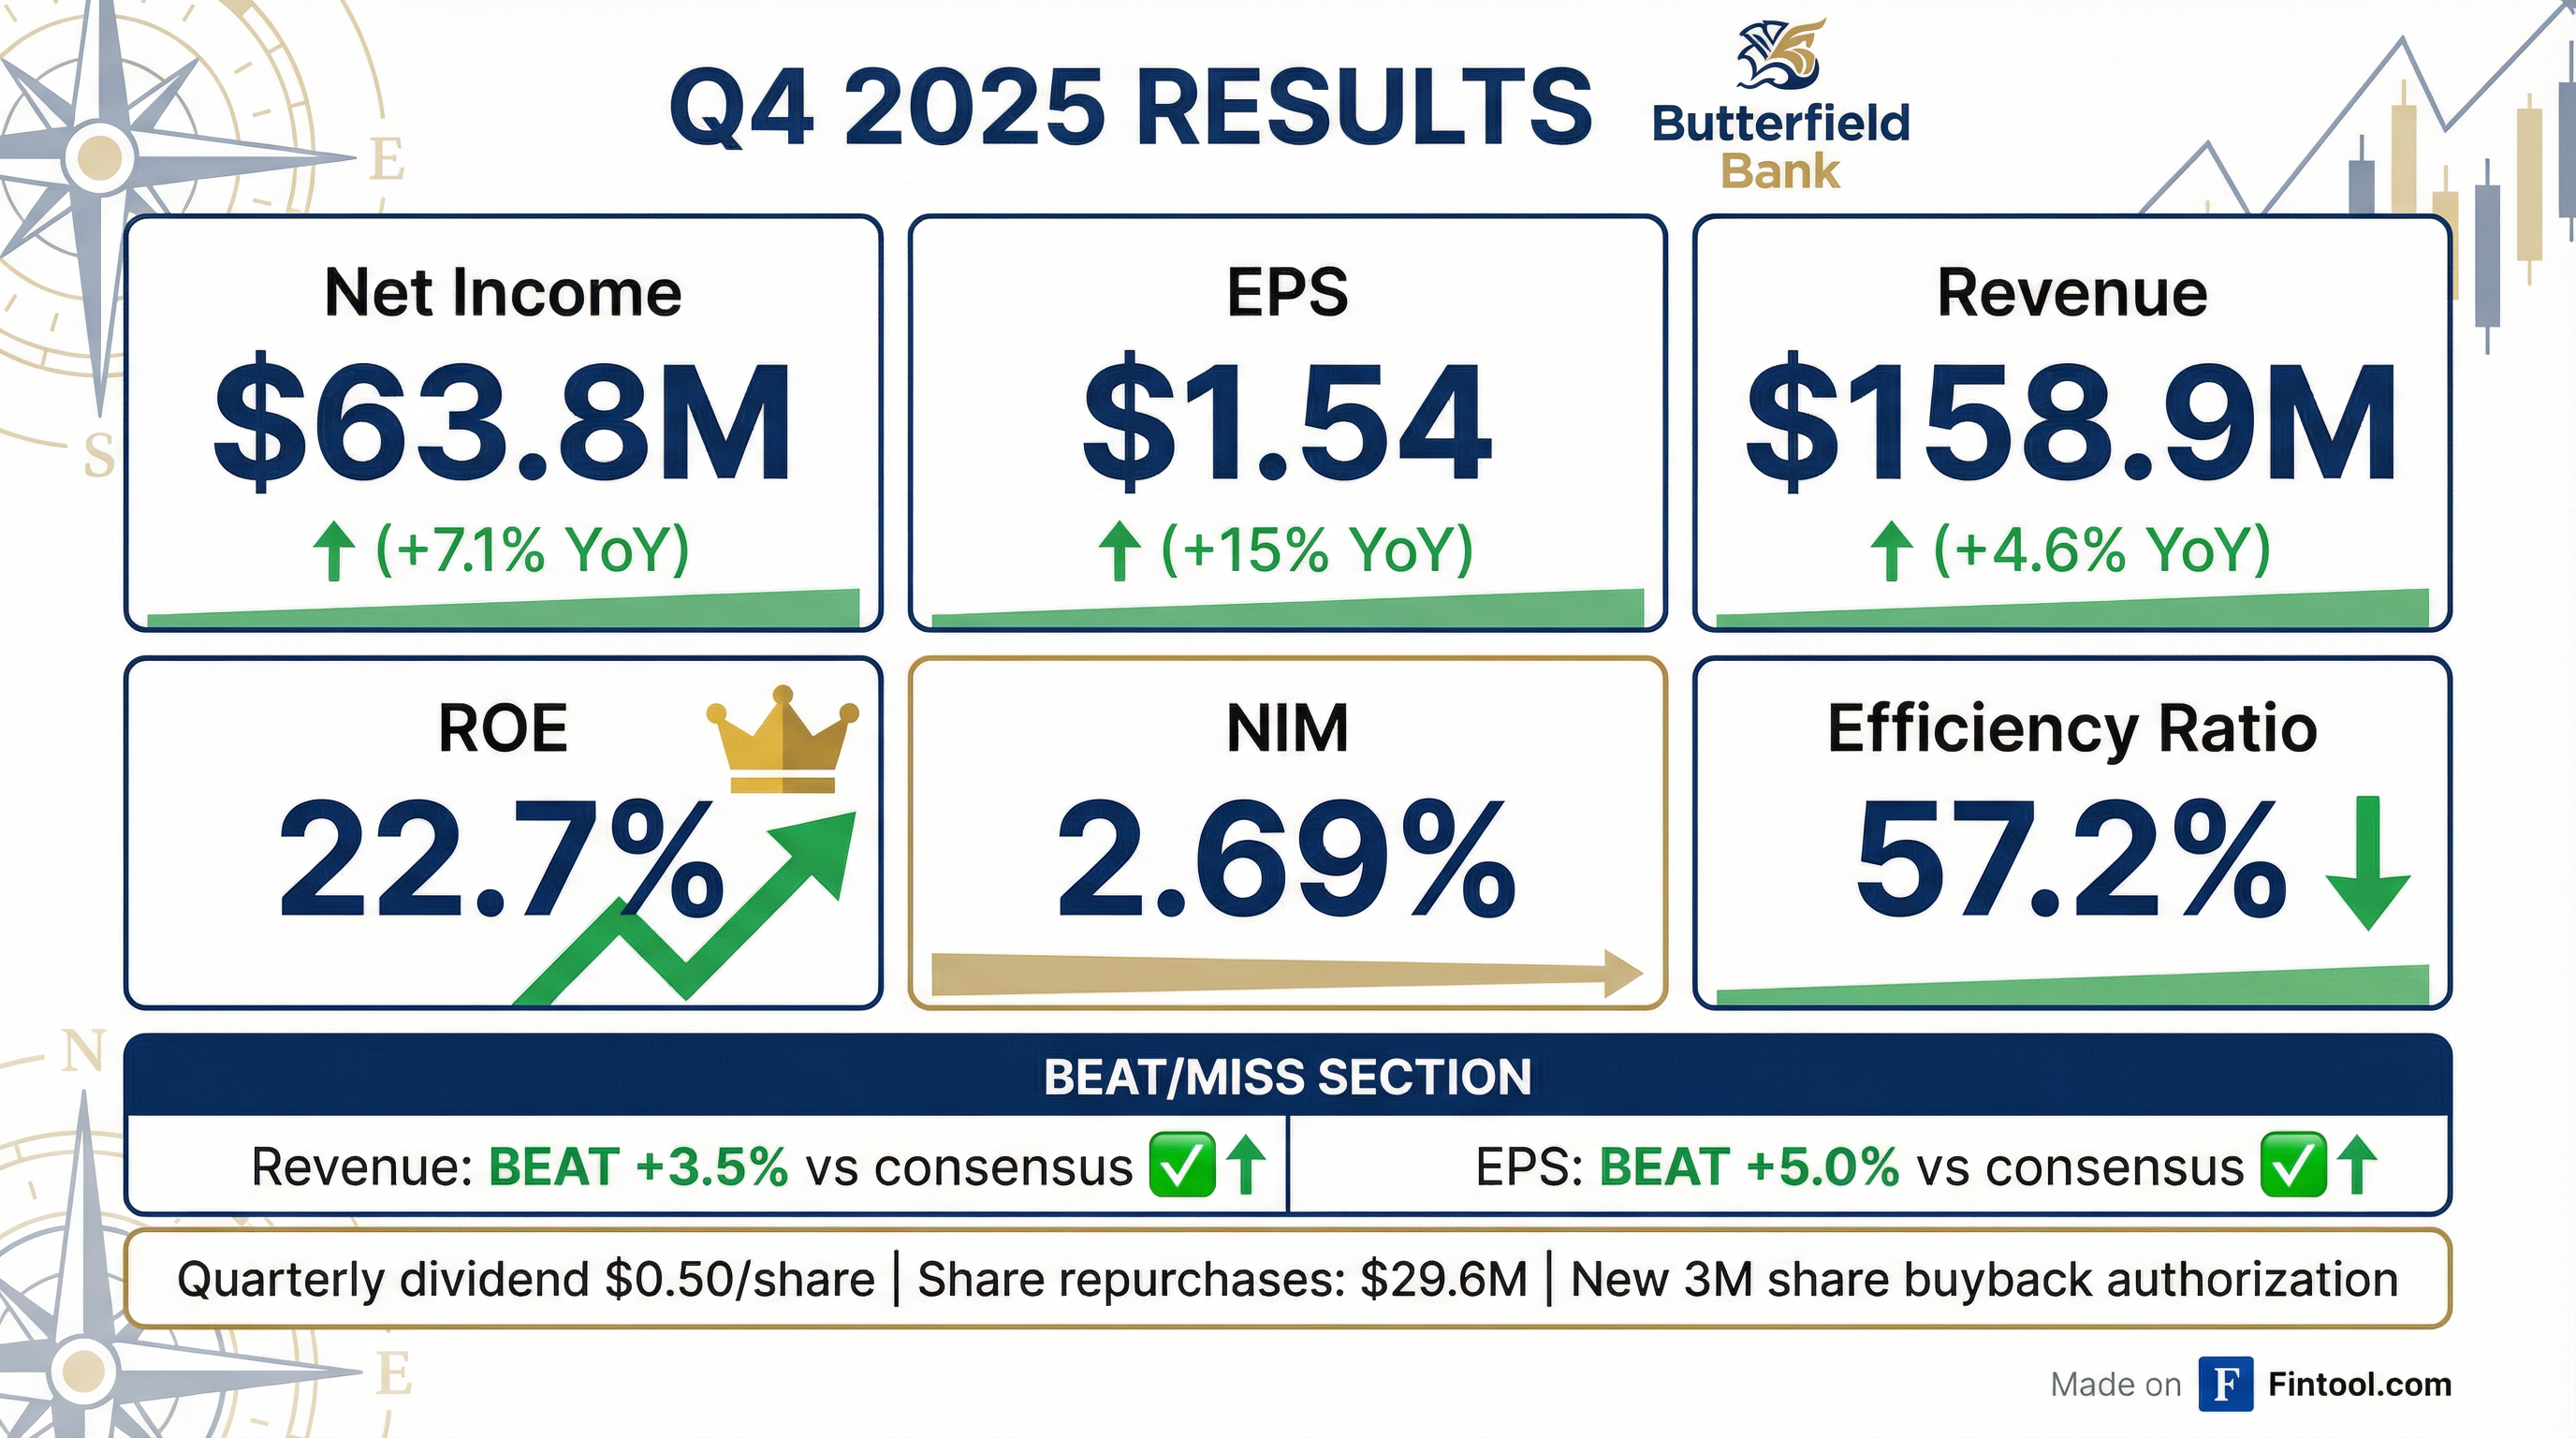
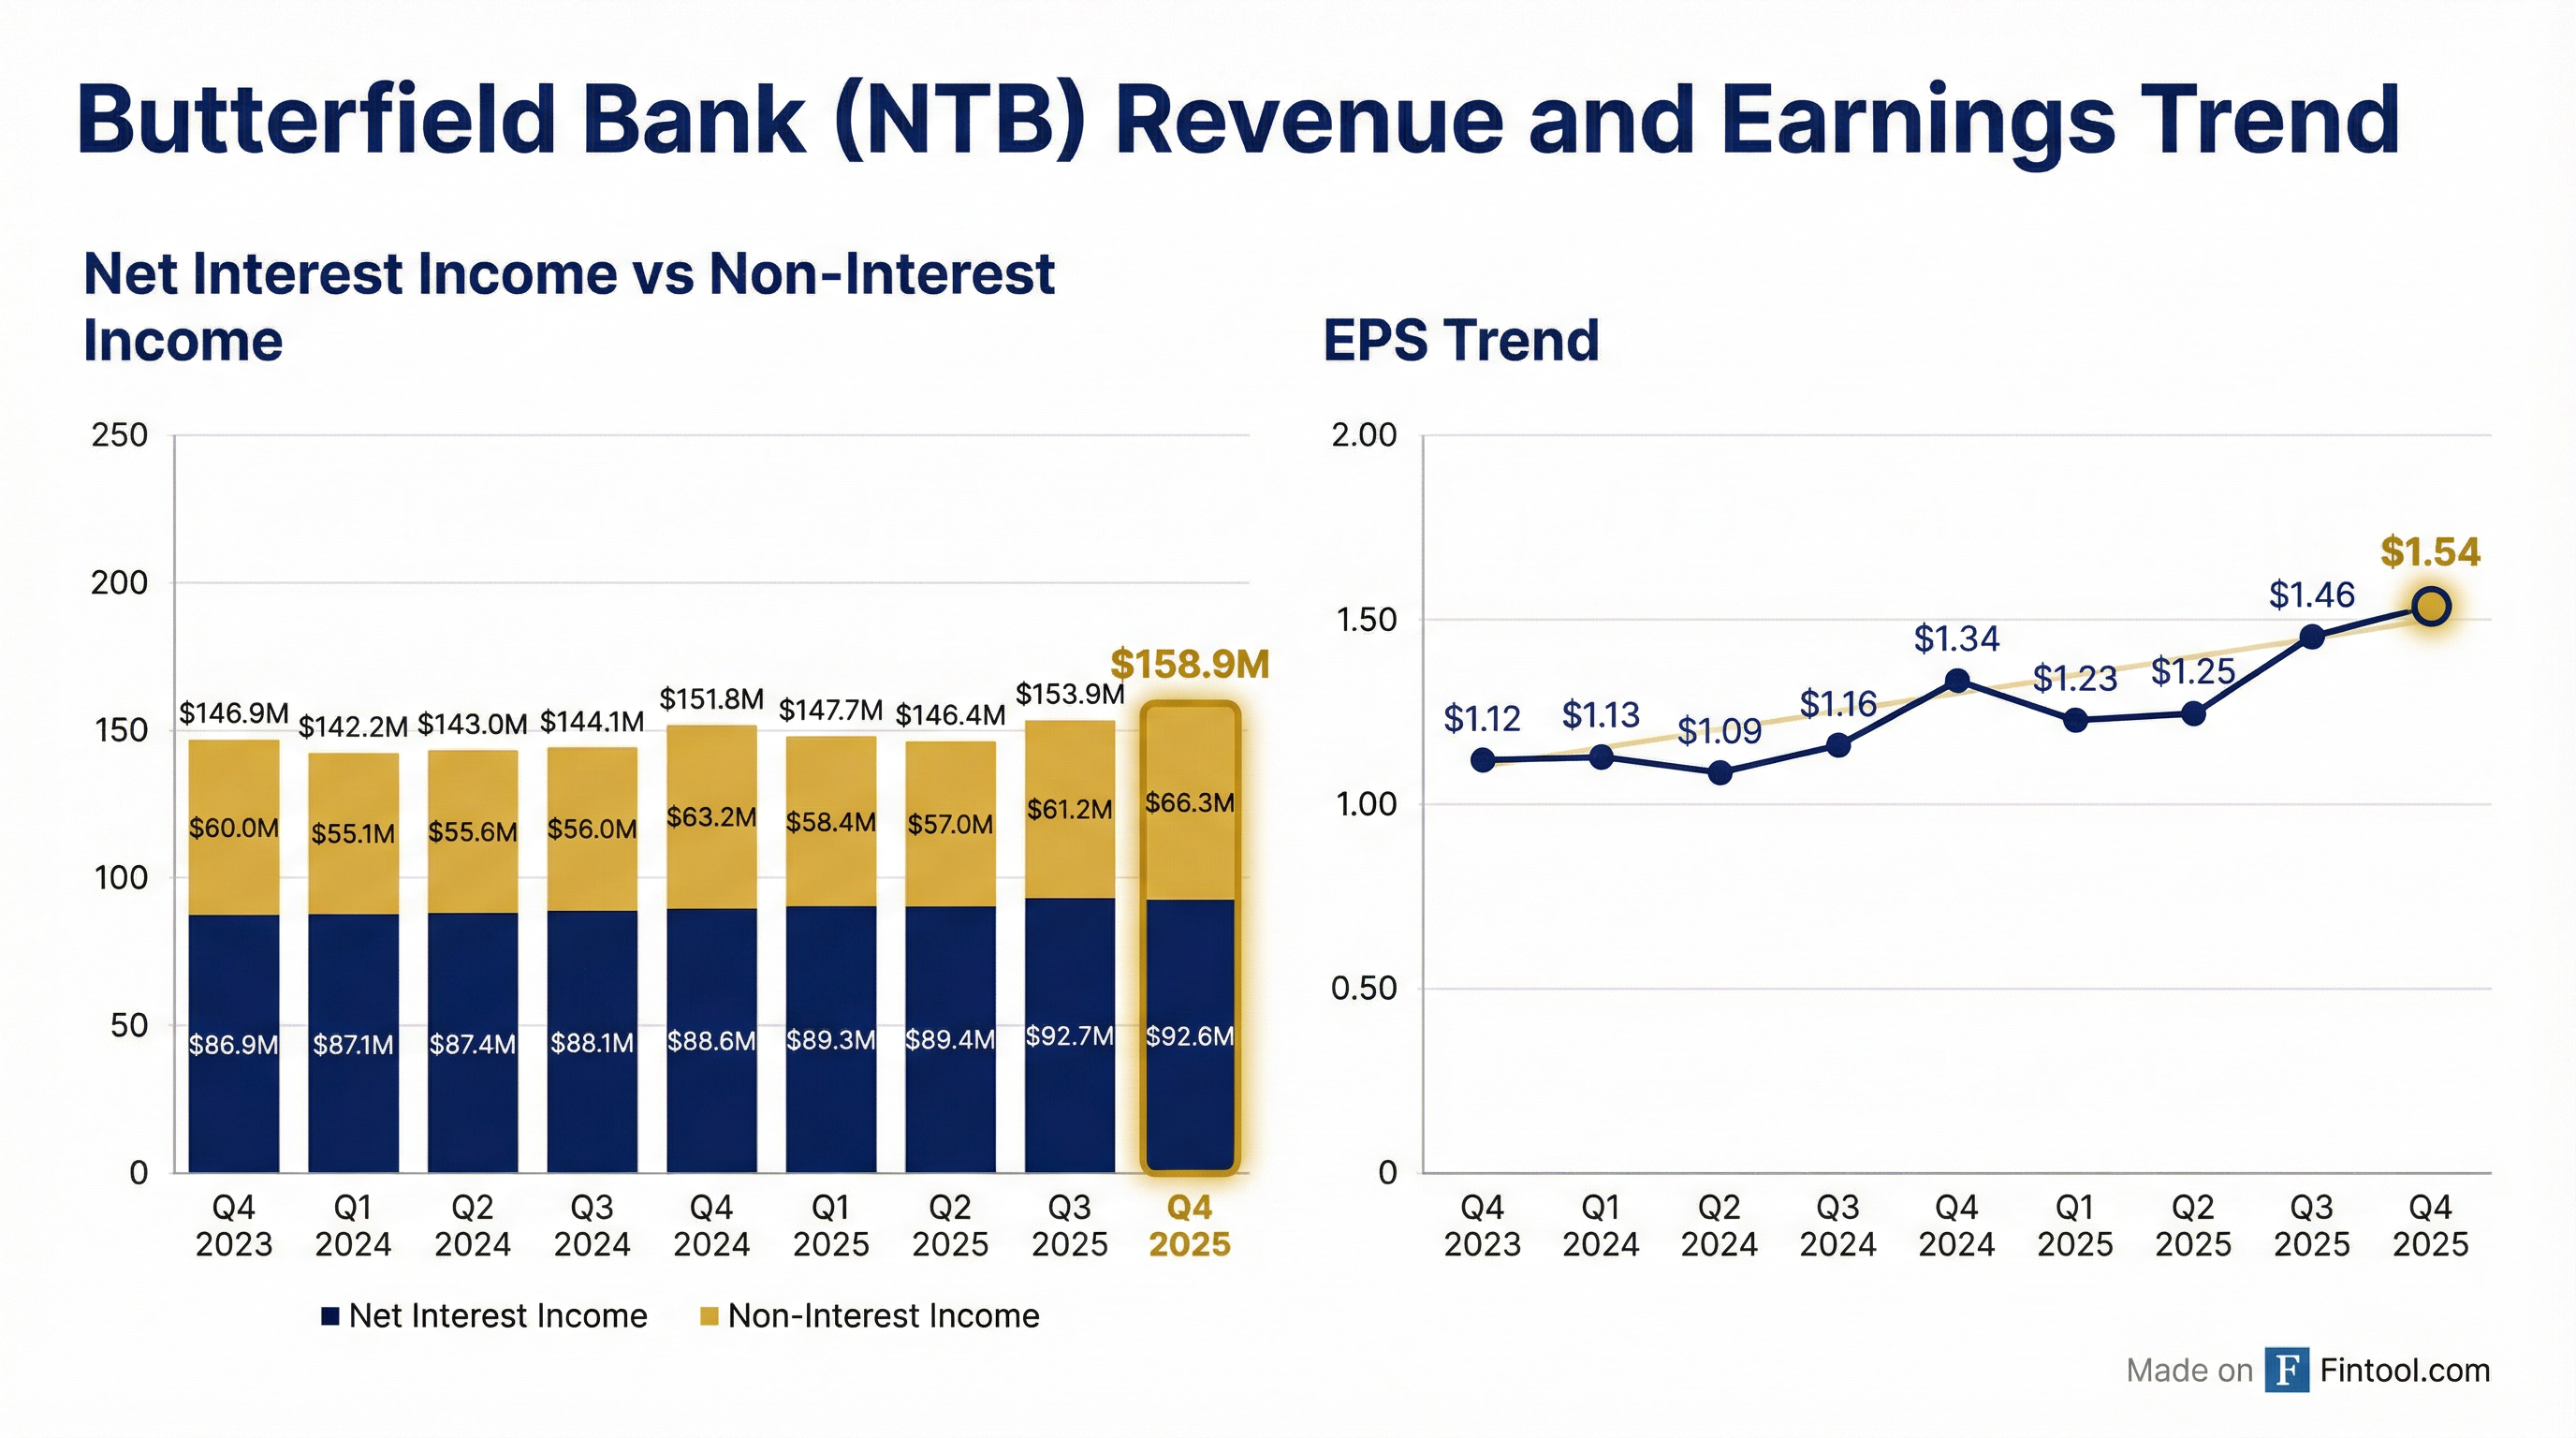
The Bank of N.T. Butterfield & Son Limited (NTB) delivered a strong Q4 2025, beating consensus estimates on both revenue and earnings while announcing an expanded capital return program. Net income rose 7.1% year-over-year to $63.8 million, or $1.54 per share, as fee income surged on seasonal card volumes and trust business wins.
Did Butterfield Beat Earnings?
Yes, Butterfield beat on both metrics:
This marks Butterfield's eighth consecutive quarter of beating consensus EPS estimates. The beat was driven by a $5.1 million quarter-over-quarter increase in non-interest income, primarily from seasonal credit card activity, trust fee increases, and rising asset management revenue from higher valuations.
What Changed From Last Quarter?
Key sequential changes (Q4 vs Q3 2025):
-
Non-interest income up $5.1M (+8.4%) — Multiple drivers: asset management fees rose on strong Q4 market valuations; banking fees benefited from seasonal card volume incentives (Q3/Q4 seasonal); FX was "a real source of strength" with new credit line functionality driving volume; trust fees increased as Credit Suisse integration completed and fee standstill expired
-
Net interest income flat at $92.6M — Lower treasury and loan yields from central bank rate cuts offset by higher investment yields as assets rotated into higher-yielding AFS securities
-
NIM compressed 4 bps to 2.69% — Down from 2.73% in Q3 as rate cuts flowed through, but still +8 bps vs Q4 2024's 2.61%
-
Cost of deposits declined to 1.37% — Down from 1.47% in Q3 and 1.73% a year ago as rate cuts benefit the liability side
-
Expenses up $2.3M (+2.5%) — Higher professional services for project work, marketing costs, and incentive accruals offset by absence of prior quarter's senior management departure costs
How Did the Stock React?
NTB shares closed at $53.40 on the trading day before earnings, up 0.77% ahead of the announcement. The stock is trading near 52-week highs ($53.85), having rallied 53% from the 52-week low of $34.86.
What Did Management Guide?
While Butterfield does not provide explicit revenue or EPS guidance, management offered specific forward indicators on the Q4 earnings call:
Explicit expense guidance:
"I would anticipate that quarterly core expenses to be around $90 million-$92 million over the next few quarters."
CFO Michael Schrum noted that Q4 expenses were elevated due to one-time professional services fees and higher incentive accruals that won't repeat. Q1 typically runs $2M lower due to seasonality.
Implied forward indicators:
-
NIM trajectory: Management expects continued benefit from deposit repricing as rate cuts flow through, though asset yields will also decline. AFS OCI expected to improve 28% in next 12 months.
-
Fee income momentum: Trust and asset management businesses gaining clients; fee income ratio of 41.7% compares favorably to peer averages.
-
Capital deployment: Active M&A focus on "private trust and bank acquisitions in order to achieve scale in island markets."
Capital Return Program
Butterfield's aggressive capital return remains a key differentiator, with a combined payout ratio approaching 100% of net income for FY 2025:
New authorization: Board approved repurchase of up to 3.0 million common shares through December 31, 2026, effective January 1, 2026.
Capital position: Total capital ratio of 27.8% remains well above the 13.5% BMA minimum and 15.4% US peer median. TCE/TA ratio of 7.5% is above the 6.0-6.5% target range.
Q&A Highlights
Key insights from the analyst Q&A session:
On fee income drivers (Michael Schrum, CFO):
"Asset management fees, obviously most—I mean, some of those are periodic fees, but most of them are driven by underlying valuations improving significantly in the fourth quarter and throughout 2025... FX has been a real source of strength this quarter and throughout 2025, actually."
On trust growth strategy (Michael Collins, CEO):
"Generally, in the trust world, you organically grow, like, 2% a year, and you have a natural attrition of about 2% as trusts come to their natural end after 30, 40 years... We're top 5 private trust company in Singapore now, and there's great growth opportunities. But generally, growth in trust is going to come through acquisitions."
On M&A focus:
"We're really focused on our existing jurisdictions for trust... we believe having trust companies in Guernsey, Bermuda, Cayman, Switzerland and Singapore—those are the best trust jurisdictions."
On credit quality (Michael Schrum, CFO):
"We're not seeing systemic shifts in NPA migration or past due migrations. It's really related to a few commercial accounts sort of scattered throughout the network, really. Mostly in Bermuda for this quarter."
On Cayman deposits: Seasonal reinsurance payment inflows drove non-interest deposit growth in Cayman Islands this quarter—nothing structural.
Balance Sheet and Credit Quality
Credit commentary: Non-accrual loans increased to 2.1% of gross loans, driven by a residential mortgage facility in the Channel Islands/UK segment. However, net charge-offs remained negligible at 0.00%, and the loan portfolio remains conservative with 71% in full-recourse residential mortgages (79% with LTV below 70%). Investment portfolio is 99.8% AA-rated.
Full Year 2025 Performance
Key Takeaways
-
Strong beat on both lines — Revenue +3.5% and EPS +5.0% vs consensus, continuing the multi-quarter beat streak
-
Fee income outperformance — Non-interest income grew 5.6% YoY; fee income ratio of 41.7% exceeds peer averages. Credit Suisse trust book fully integrated with fee standstill expired
-
NIM resilience — Despite rate cuts, NIM held at 2.69% as deposit costs fell faster than asset yields
-
Aggressive capital return — Combined payout approaching 100% with new 3M share buyback authorization
-
Expense discipline — Management guides to $90M-$92M quarterly run rate; Q4 elevated by one-time items that won't repeat
-
Credit stable — Non-accruals ticked up but no systemic migration; isolated commercial accounts in Bermuda
-
Trust growth via M&A — Organic trust growth ~2% with ~2% attrition; acquisitions remain primary growth lever. Singapore office now top-5 and in growth mode
Peer Group Context
Butterfield compares itself to these regional banks: FHB, BOH, EWBC, CFR, ASB, WTFC, CBSH, TRMK, IBOC, CBU, FFIN, WABC, and UMBF.
Key differentiators vs peers:
- Higher fee income ratio (41.7%) vs peer averages
- Lower loan-to-deposit ratio (35%) vs 70% peer median — conservative liquidity posture
- Higher capital ratios — TCE/TA 7.5% (but excess capital when adjusted for cash)
- Unique geographic footprint — Bermuda, Cayman, Channel Islands with minimal US exposure
- Trust leadership — Top 5 private trust company in Singapore; Credit Suisse trust book fully integrated
Data sources: Company filings, S&P Global